


Internal data shows that De Anza College has seen a steady decline in enrollment for the past nine years
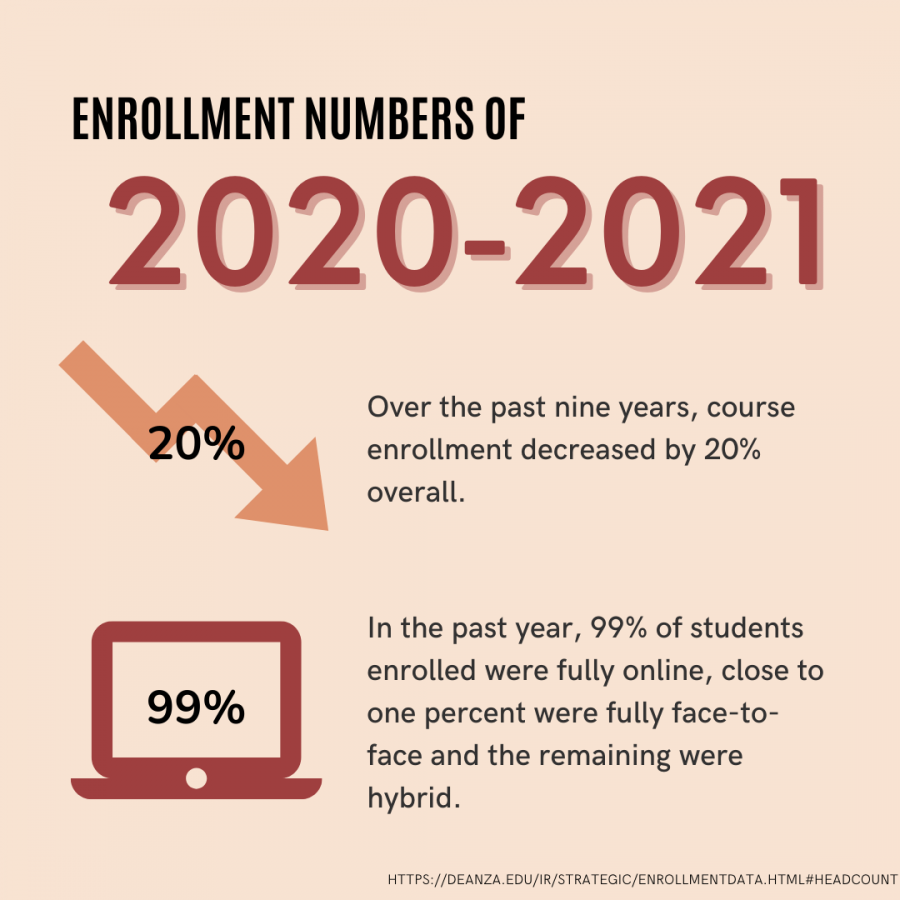
Enrollment has been on the decline not only this past year since the pandemic started, but also over the past nine years. The pandemic has had an effect however, affecting the number of students enrolled fully online this past year by an increase of 99%.
From the years 2013 to 2021, De Anza College has seen shifts in various enrollment trends. Over the past nine years, the school has seen overall enrollment steadily decline by 20% while full-time online enrollment saw an increase by 22% compared to numbers pre-summer 2019 and then a nearly 99% increase since the pandemic.

There are various causes and connections to this decrease in enrollment, such as the pandemic or Cupertino’s shortage of affordable housing, and it is likely that these trends continue in the coming years.
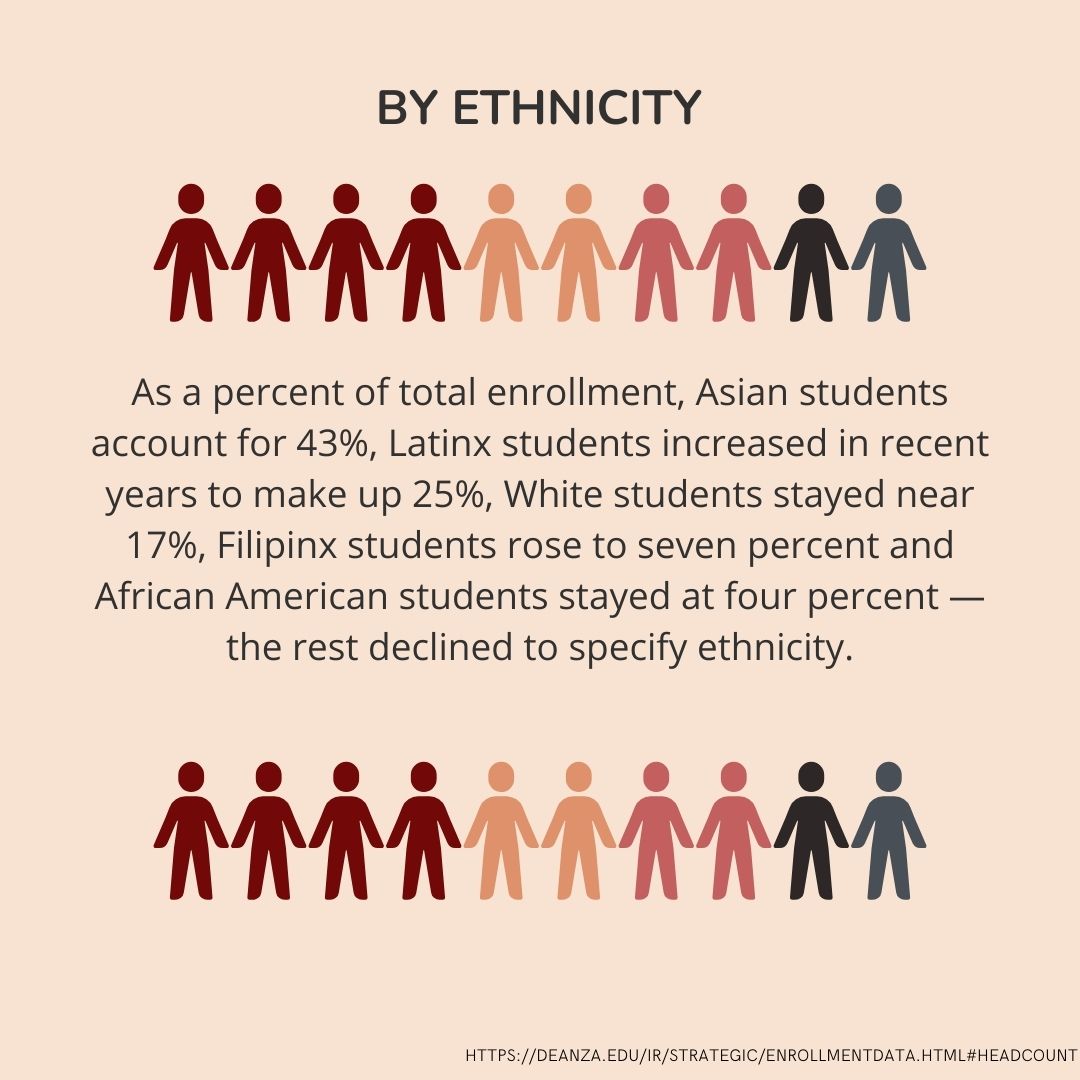
The school has only seen minor changes in demographics. Of the total amount of enrollment from 2020 to 2021, 43% identify as Asian, 25% as Latino, 17% as White, 7% as Filipino, 4% as African American, 1% Pacific Islander and less than 1% Native American with the remaining unspecified.
All categories, factoring in overall decline in enrollment, have seen some percentage of decrease. For example, 1,104 students enrolled in 2013 identified as Native American compared to 563 students enrolled today, a 50% decrease within nine years, and the White and African American student populations both decreased by roughly 36%.
Making up the majority of the non-White students, Asian specific enrollment data can be split into nine subpopulations that all but one show decline over the years. The Asian Indian and Korean student populations both decreased by 45%, Chinese decreased by 39%, Japanese and Pacific Islander by 31%, Loatin by 19%, Filipin0 by 17% and Cambodian and Vietnamese by 9%. There has also been a 83% overall increase in enrollment for those who identify in the “Asian Other” category, with the year 2021 seeing its highest number of 13,072 “Asian Other” students compared to only 7,152 in the year 2013.
Additionally, students with only a high school degree or equivalent education are the highest group of students enrolled accounting for an average of 81% of the total population.
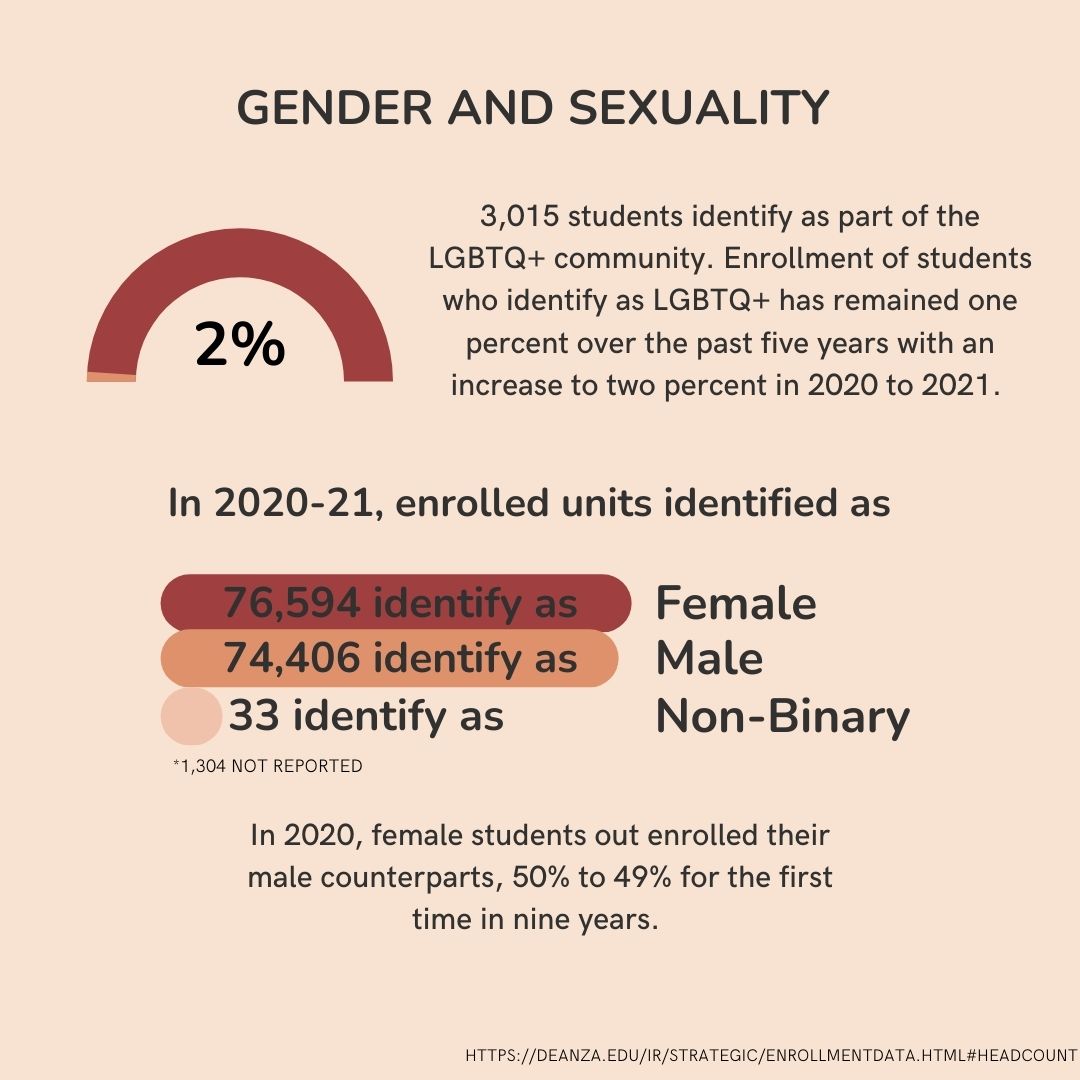
Finally, enrollment of students who identify as part of the LGBTQ+ community has remained at 1% over the past five years with a small increase to 2% in 2020 to 2021. Total number of those who identify as non-binary decreased from the previous year, from 69 to 33 students. And in 2020, female students out-enrolled their male counterparts, 50% to 49% for the first time in nine years.
The De Anza Research and Planning Office publishes internal data yearly that can be reviewed here.

Ayah Ali-Ahmad is the current editor-in-chief and former news editor for La Voz. She is a sophomore at De Anza College, studying to transfer for a bachelor's...